
Lesson 7 Trend, Support & Resistance
Lesson 7 – Trend, Support & Resistance
Although Technical Analysis is a modern technique which has become more popular due to the accessibility of information through the Internet and home computers, Technical Analysis has actually been used since the early 1900’s.
The Grandfather of all Technical Analysis is known as DOW Theory. Many viewers will be familiar with the name DOW, as Charles DOW created the DOW Jones Industrial Index in the early 1900’s. He believed it reflected the business conditions of the economy. While the DJIA has changed significantly over the last 100 years, it is still a key Index to analysing current market conditions.
Behind DOW Theory is the concept of Trend — which has been the basis of investing and trading for the last century.
In this lesson, you will learn what a Trend is. We will explore the concept of Time-Frame analysis and explore what defines a trend. We will introduce you to Support & Resistance and discuss its importance in your every-day decision-making process.
A Trend is an assumed tendency for a market or stock to move in a particular direction, over a certain amount of time. A Trend can be only one of three directions:
- Up
- Down, or
- Sideways.
In Technical Analysis language, we have multiple names for these trends:
- An uptrend is also a Bull market or going Long
- A downtrend is a Bear market or going Short
- A sideways market is a Crab market or Trading Range or could be referred to as Marking Time.
| A trend is defined by a | – |
| series of High and Low | |
| points. An upwards trend | |
| has Higher Highs and | |
| Higher Lows. A | |
| Downwards | |
| trend has Lower Highs andPrice | |
| Lower Lows. While a |
cirlPwakic trpnri hac Prilinl
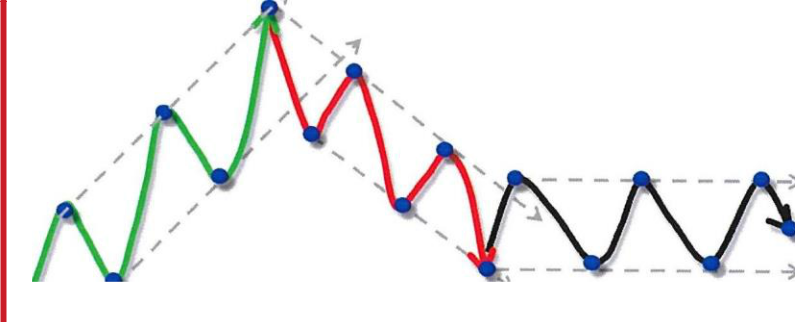
When drawing a trendline, we connect the series of higher low points together for an upwards trend and we connect a series of lower high points together for a downwards trend. For sideways trends, we connect a series of equal highs and equal lows together. For a trend to form, we must have at least two points. However, the more points that form on the trend, the stronger that trend becomes.
There are varying lengths of time that you may analyse. There is no right or wrong answer with regards to which Time-Frame is best, as this will be due to the type of trading or investing you intend to conduct. For some traders, short-term analysis might be 5 minutes. Whereas short-term analysis for long-term investors might be 5 months.
What we will define in terms of Time-Frame analysis is a standard setting for End-of-Day traders.
Traditionally, as defined by DOW Theory, there are three trend types:
- Primary Trend: this is like the movement of an ocean Tide
- Secondary Trend: is similar to the wave movements on the ocean
- Daily movements: is compared to ripples on the waves.
All three of these trends move at the same time.
To define a time-frame for each of these trends, with respect to an end of day trader, the Primary Trend would be 6-months or greater. The Secondary Trend would typically be about 3-months. There is some variance here as a Primary trend requires multiple Secondary Trends to be defined. And finally, the short-term movements would be defined as Daily price activity. Therefore, the candlesticks or bar charts that you are using would be set as Daily.
Putting this all together, we can see from this chart that the smaller daily ripple movements will make up a Secondary Trend. While multiple Secondary Trends will make up the Primary trend. The highs and lows of the Primary Trend we refer to as Peaks and Troughs.
Over the last 100 years, nothing has changed with regards to the theory of trend analysis or how we analyse the 3 types of trends. However, the volatility or frequency of trend changes has. This is due to the Information Age, where we can easily access data at an instant through the internet and the exponentially increasing amount of trading activity that is occurring.
One key to Trend analysis is identifying when a Trend has ended. We have a saying in Technical Analysis: The Trend is your Friend … until the End! What this means is that when you identify what direction the trend is in, follow that trend and only trade in that direction, until you have a signal to tell you otherwise.
The biggest mistake traders make is trying to second guess the trend direction. This is a big “No No”, which we all experience at some stage, and rue the fact that we did. But this is part of your learning experience.

the trend has been forming higher lows and higher highs. At every stage along this trend, we have no idea when this trend is going to end. Only in hindsight do we know when the Peak has formed. At some stage, because no trend can last forever, selling pressure or profit taking will cause the stock price to retrace. This could mean that it breaks the previous low, or it might just mean that the price stalls before the previous high.
In either case, once we have formed both a lower high and lower low, we have a Change in Trend.
Remember, the more points we have to form a trend, the stronger it is. Hence the patient trader would actually wait for the price to break the next low point to confirm the trend is in place.
So what would we need to define an end to a Downtrend? A change in direction for a Downtrend would need a Higher Low and Higher High. Just like our previous example, while the downtrend is in play, we do not know how long it will last. Once a Higher Low and Higher High have formed, we can then identify a change in Seller & Buyer sentiment. Buyers have become stronger and forced the change in direction.
Again, we like to confirm the change in trend with a second higher high or higher low. In this example, two higher lows and 2 higher highs would denote an established trend.
A change in direction for a Sideways trend is a little different. Neither buyers nor sellers are in control. We have equal highs and equal lows. Once the price breaks through either the highs or lows, this is the initial signal that the sideways trend has been broken. But we will need to have at least 2 points of consecutive directional lows or highs to define a new trend. Obviously the break of the highs or lows signifies one of these. The other may have already formed within the sideways trend or trading range, or it may form after it has broken through.
The angle of the trend can have significant bearing on the longevity of that trend. The ideal angle for trading end of day is a trend at 45 degrees. A low angled trend is likely to last longer, but will have very slow trending movement. It
could take a very long time to achieve any significant gains. A high angled trend is moving quickly, but it will also reverse very suddenly, and could cause you to lose the gains you have made.
Study of the sideways trend leads us to our next topic: Support & Resistance.
need to see at least two points to identify support and the more times a stock price holds support, the stronger that support becomes.
Resistance is a price level where there is significant supply of the stock which will lead to a halt in the upwards movement of the stock price. We also need at least two points to identify resistance, and the more times a stock halts at a certain level, the stronger the resistance is.
It is also uncanny how Support & Resistance levels typically occur at round numbers. This is due to the phenomenon of market psychology. Traders and investors will typically place their Limit orders at round numbers causing a congestion of orders. This can cause a stock price to stall at that level, and if significant enough to entice more market participants, reverse the direction.
Most charts will have multiple Support & Resistance levels. For beginners, it can be a little confusing in choosing which levels are most significant. So here are the general rules:
- Choose levels that have multiple points. The more number of points, the more significant
- Evaluate previous highs and lows
- Consider round numbers
- Market depth can give you insight to significant levels
- Previous Resistance could be Support in the future, and vice versa.
- Historical levels can have bearing on future activity, but the more recent the S&R, the more the markets will remember.
In the following charts, we have some examples of Support and Resistance that has formed. (x2)
Now that we have learnt what Trends are, how to identify a change in trend, and how to use
Support and Resistance, let’s begin exploring some key significant affects that will help you with your decision-making process.
Fanning Trend Lines
Previously we had discussed the angle of a trendline and how to place trendlines onto price activity, where we draw a trendline on the higher lows for an uptrend, and we draw a trendline on the lower highs for a downtrend. Fanning Trendlines is a technique that will help you optimise your trading and profit from changing conditions in a trend.
The Fanning Trendline technique is where we draw multiple trendlines to represent the changing speed/angle of the trend. For example, here we have a slow trend at a low angle. Momentum begins to accelerate
… …. A J. 1… J. ..J
buyer sentiment.
Pric

e
We can use a Trend Fan to help exit a position, or to expect a point of support or resistance. On break of the fast, high-angled trend, we could expect the share price to retrace at least to the previous trendline. But there is also a reasonable expectation that it could retrace back to the longer-term slower trend.
Here we have an example of a chart with increasing trend speed in an upwards direction. And here is an example of a downwards trend that has broken and rallied back to the previous trend.
Phases Cycles & Trends
The overall movement of a stock or market can be defined by certain phases or cycles.
Stock prices, and the markets as a whole, move in 4 phases. These 4 phases make up the life cycle for that share/market. At times, these cycles will move quickly from one phase to the next, but could also take several years to complete.
The reason we discuss this concept is that the different phases will suit different styles of trading and will use different strategies.
Here we can see the distinct phases.
1 Phase 4
.
Phase 2 is a Sideways consolidation period where the downwards trend has been halted as there are no longer sufficient sellers in the market to continue the previous downtrend. There is some renewed buyer support, causing the Sideways trend to form.
Phase 3 is an upwards trend. Buyer dominance has returned, causing the stock price to rise. This could rise to previous high prices where investors believe the stock should return to, or it could be that the stock price continues to push into new territory.
At some stage, however, Buyer demand is likely to exhaust itself. This can lead to the final Phase 4 where a consolidation or sideways movement occurs at the top of an upwards trend. Low demand and an oversupply of selling pressure can cause the trend to stall.
In this example, we can see the distinct difference in the phases on the chart.
Consecutive series of this 4 Phase movement will form cycles. There is a general consensus that the stock market moves in 10 year cycles, but also in 4 year cycles. Many viewers will probably be familiar with the 7 year Property cycle that we have become accustomed to.
Cycles change from market to market, and from generation to generation. It is best not to assume that a cycle will last for a certain period of time, but to be consciously aware that cycles exist, and how to identify which stage of the cycle the market or stock might currently be in.
The study of Trends, Support & Resistance is a key to successful trading and investing. In this lesson, you have learnt what a Trend is. We have discussed the concept of Time-Frame analysis and explored what defines a trend. We have introduced you to Support & Resistance and discussed its importance in your every-day decision-making process.
In the following lesson, we will explore Chart Patterns and how they can help you trade successfully. And, we will introduce you to key patterns that have a high probability of success.