
Lesson 9 – Indicators
Lesson 9 – Indicators
While Technical Analysis has been developed around the study of price and trends, this has not solely been limited to the study of charts.
Technical Analysts also use mathematics to help analyse price movement in the attempt to evaluate the balance between buyers and sellers. The mathematics used in this endeavour forms Technical Indicators, which have also been developed over decades of study, practice and use.
As computers are so predominant in today’s society, the use of Indicators as a primary means of decision making has become an extremely popular method to trade.
In this lesson, we will introduce you to the concept of using Indicators for decision-making on entry and exit points for trading. We will introduce you to the key indicators: Moving Average, Relative Strength Index, Stochastic Oscillator, Bollinger Bands and On Balance Volume, and how they can be used to define timing of entry and exit.
Using mathematics is not a new concept for share investing. Fundamental analysts have been using it to study company performance for centuries. However, over the last 100 years as price data has become more readily available, some pretty bright people have applied mathematics to share price data.
Today, indicators are a predominant decision-making tool, made far more accessible to the average person due to the internet and computers.
You will recall from our lesson on Charting & Technical Analysis that only 5 pieces of information are provided by the stock exchange: the Open, High, Low, Closing prices and Volume. From this information, we can mathematically analyse different aspects of buyer and seller demand.
All mathematics for Technical indicators fall into 1 of the following 5 categories:
- Trend
- Momentum
- Price
- Volume, and
- Volatility
As a technical analyst, the key is to either choose a discipline to trade, that is; establish a trading plan to trade the trend, or to trade momentum for example. Or, to establish a trading plan that encompasses aspects of all categories, but not to use too many indicators from the one discipline. For example, if you used 3 different indicators from Volatility analysis, it is not going to make your
It is also imperative that you use the right indicator for the right type of market conditions or stock. A trending stock would best suit a trending indicator such as the Moving Average. While momentum indicators might offer numerous alerts, your frequency of trading will be such that you may lose all advantage. Oscillators will give off a number of false signals in a trending market, whereas, they are better suited for a ranging market as you look for short-term swings.
Through this course, we will introduce you to the key indicators that are commonly used for trading decisions, with a focus on Trend, Momentum and Volume analysis. Note, we will not be spending this course focussing on the mathematics. Whilst some of us may find enjoyment in the topic, the key to using indicators is understanding what they represent, and how to interpret the information on the chart, and identifying the strength or weaknesses of buyers and sellers.
The first indicator we will investigate is the Moving Average.
Unable to load the shape
| Day | Close Price | Total 5 periods | Average 5 periods |
| 1 | 2 | – | |
| 2 | 4 | ||
| 3 | 5 | – | |
| 4 | 8 | ||
| 5 | 9 | 2+4+5+8+9= 28 | 28/5= 5.6 |
| 6 | 7 | 4+5+8+9 +7 = 33 | 33/5 = 6.6 |
| 7 | 9 | 5+8+9 +7+9 = 38 | 38/5 = 7.6 |
Unable to load the shape
A moving average is a simple way of ‘smoothing’ out the price activity viewed on the chart. It is a Trend Following indicator, also referred to as a Lagging indicator, that reacts to market movements. It is one of the most popular indicators as it is easy to use and understand.
To calculate a moving average, we use the closing price. We add the number of sequential closing prices together and divide by how many were added. This will give us an average price for that series. On the next day, we
disregard the first number and now recalculate the new subset with the current figure. We divide by the number of data points analysed and we then have a second average.
For example. Here we have a series of numbers over 5-days. To gain the average for this series, we add the numbers together and divide by 5. On the next day, we have new data. We disregard the first days’ information and add together the latest 5-days of data, divide by 5 and have a new
average. Each day, we recalculate.
This provides us with a series of average figures, which can then be plotted.
This mathematical calculation is actually referred to as the Simple Moving Average. There are 3 types of Moving Averages:
- Simple
- Weighted, and
- Exponential.
A weighted moving average gives different weights to different data points based on its age. The oldest period, for example, is given a weight of 1. The next oldest period is given a weight of 2, the next oldest period is given a weight of 3 and so forth. Each periods price is multiplied by its
weighting before the average is calculated.
The Exponential moving average gives more weighting to more recent prices and decreasing weight to older data. However, the older data never goes away
There is no right or wrong answer as to which type of Moving Average is better. Many traders will use the Exponential MA due to the fact that it encompasses all data and provides weighting to the latest trading. However, many traders also like to use the Simple MA.
As with all indicators, you are best to practice and evaluate results to ensure you are confident in its signals.
Choosing the setting for your Moving Average is critical. The smaller the set of data you are analysing, the more price sensitive the MA will be. Smaller settings will react quickly to price changes, but will give you many signal alerts.
A longer setting will smooth the price activity out more, but will offer fewer alerts. At the same time, the reaction of the long MA setting will be slower, and can find much of the price movement already occurring before you enter or exit the position.
As a rule of thumb, your starting point for settings of moving averages in reference to end of day analysis are:
Short-term: 15-day
Medium-term: 50-day
Long-term: 200-day
Remembering that the Moving Average defines a trend. So these settings reflect the type of trend you are analysing.
One key to using MA’s is to use multiple averages on the chart. The Double MA or Multiple MA method of analysis can offer stronger signals for entry and exit. Again, remembering that MA’s are a Lagging indicator, which means entry and exit of the trend will be slightly later.
When using multiple MA’s, the signal occurs when the shorter MA crosses the medium-term MA. Such as here, here, and here. As we can see from this chart, the short-term MA crosses above the longer MA for a signal to go Long. And then, at the end of the trend, the short-term MA crosses below the longer MA for a signal to go Short.

2011
A special note about the MA. It is a trend
following indicator. This means it is best used for trending markets or stocks. If the share price is travelling sideways, it does not have a trend. The MA will provide multiple signals in a sideways trend, that will typically be unprofitable. Therefore, do not use MA’s in a sideways trading market.
Moving Averages are trend following indicators which can assist you in your timing of entry and exit. They are a lagging indicator, so the longer the setting, the more time before a signal is generated.

The next indicator we will introduce you to is the Relative Strength Index, or RSI.
The RSI is a Momentum indicator. It is a Leading indicator that measures the ratio of up days to down days over a given period of time. Its’ goal is to give us an idea of the internal strength of the stock.
The premise is that it measures the velocity at which prices are moving. Just like if we were to throw a stone up in the air. The velocity at which it leaves your hand is when it is at its greatest. As it reaches the top of its trajectory, the momentum begins to slow. Subsequently, the direction changes and velocity picks up again.
By measuring the velocity and looking for any changes in the momentum, we can identify when a change in trend is about to occur. Hence, it is a Leading indicator.
We read the RSI by establishing whether the stock price is Overbought or Oversold. The indicator is not applied over the share price, but as an indicator separate to the price. Here we can see a chart with the RSI applied separately.

The scaling of the RSI is between 0 to 100. When the indicator reaches a peak and turns down, this identifies a top to the trending movement. Whilst trading above 70, this is the Overbought Range. So a downwards turn that falls below 70 would suggest an end to the upwards trend.
When the indicator reaches a bottom and turns up, this identifies a bottom to a trending movement. Trading below 30 is the Oversold Range. An upwards turn through 30 would suggest the end of the downwards trend.
Traditionally, the indicator is set at 14-days. Many analysts will adjust this setting, testing figures between 9 and 21 days. It is recommended that any adjustments are thoroughly back-tested first before implementing as part of your trading plan.
We can see from the following chart, two RSI indicators have been applied, at different settings. Note the difference in the changes from Overbought to Oversold.
A very important aspect to using Momentum indicators such as the RSI is a concept called Divergence.
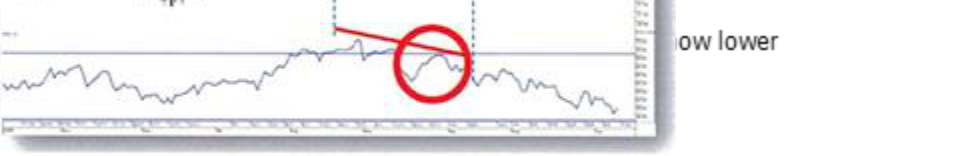
As we can see from this example, the stock price has formed higher highs, but the RSI has lower highs. Notice how the 2nd lower high is below the 70 level? This is a stronger signal for Divergence, suggesting momentum of the upwards trend is coming to an end.
In the next example, we have Bullish Divergence. The stock price is forming lower highs, but the RSI has formed higher lows. Again, the second higher low is above the 30 Oversold level, and this suggests the downwards trend is losing momentum.
As with all indicators, the RSI and Moving Averages are best used in conjunction with other indicators from different family groups. By using multiple (proven) indicators together, we can strengthen our entry and exit signals.

In this example, we have applied a Moving Average Crossover with an RSI. As the RSI is a leading indicator, it gives us a “heads-up” that this upwards trend is losing momentum. Note the Divergence that has occurred? As the trend turns, the Moving Average crossover signals as it is a Lagging indicator.
divergence in the RSI with 3 points of lower RSI highs and 3 higher stock price highs. We would monitor for a clear MA crossover to enter a Short position. As the time frame for this divergence is over a longer period of time, a longer setting to our MA cross would be better suited.
RSI’s are helpful in identifying early entry or exit to trending movements. They are particularly helpful for short-term trading during trading ranges as the indicator identifies short-term momentum changes in a sideways trend.
The next indicator we will evaluate is the Bollinger Bands.
Bollinger Bands have been a popular method of analysis since the 1980’s. They are a measure of volatility in the stock, offering the opportunity to measure the “highness or lowness” of the price relative to previous activity.
Plotted on the chart over the price activity, the Bollinger Bands are 2 standard deviation lines calculated around a moving average. Sounds complicated … but really it’s not!
As a measure of volatility, the bands adjust themselves to market volatility. The more volatile the activity in the stock price, the more the bands will widen. Tight bands means the stock price has low volatility. However, stock prices rarely remain stagnant for too long. So tight bands will typically be followed by a shift in the share price.
Here we can see a chart with the Bollinger Bands. Note the strong price movements are accompanied by the bands exploding widely. When the share price remains steady, losing volatility, the bands begin to tighten again.
Bollinger Bands can be used in
numerous ways. Firstly, Upwards L.
trending price will fluctuate between the moving average and the upper band. Downwards trending price will fluctuate between the moving average and the lower band.
Secondly, the upper and lower bands can be used as price targets. A cross from below to above the MA would signal to go Long and our price target would be the upper band. Conversely, a cross from above to below the MA would signal to go Short and our price target would be the lower band.
Finally, we mentioned before a Contraction of the Bands. Tight bands suggest volatility has decreased in the stock price. As this will not last indefinitely, we can prepare ourselves for a potential ‘explosion’ in the stock
price. The difficulty here lies in which direction the stock price is likely to breakout. This is where using our charting skills can help. Treat the contraction as a short-term consolidation, and monitor for a break above resistance or below support with supporting volume activity. Also look for the bands to begin expanding away from the average level.

Unable to load the shape
The next indicator we are going to evaluate is the Stochastic Oscillator.
The Stochastic, as it is referred to, is another momentum indicator. The word stochastic means Random in Greek. As an indicator, the Stochastic measures the location of the current price in relation to its price range over a period of time in an attempt to predict price turning points.
The premise of this indicator is that prices tend to close nearer the extremes of a recent range before turning points form.
As a momentum indicator, the Stochastic is similar to the RSI as it is a Leading indicator looking for a signal before the price reacts.
We also have Overbought and Oversold regions on the indicator. Overbought is defined by 80%, whereas the Oversold level is defined by 20%. There are 2 indicators plotted on the graph: the Slow Stochastic (referred to as the %D line), and the Fast Stochastic (referred to as the %K line).
There are multiple signals the trader could use on the stochastic indicator.
Primarily, identifying Divergence between the stock price and the indicator can form a strong signal that momentum in a trend is coming to an end. Just like our RSI, we look for diverging highs and lows between the Stochastic and the stock price.
The signal, however, is given on a crossing of the slow and fast stochastic lines. Especially when there is a crossing down from the Overbought region, or crossing up from the Oversold region.
Finally, the last indicator we would like to introduce you to in this course is On Balance Volume, or OBV.

OBV is a technique based on a
cumulative total of volume. The indicator will rise or fall each day, depending on whether prices close higher or lower
than the previous day. The goal of the indicator is to show whether volume is flowing in or out of the
Each day a share price rises, the volume is added to the previous days volume. We call this “Up volume”. Each day the share price falls, the volume is subtracted from the previous days volume and is called “Down volume. Subsequently, a line is plotted for the running totals.
If a stock price were to steadily rise, we would expect the OBV to steadily rise. Vice versa for a steady fall in stock price.
OBV is considered a leading indicator. When volume increases or decreases dramatically without significant change in stock price, at some stage, the stock price is likely to follow. OBV tracks changes in traders’ involvement in the markets.
If OBV diverges from the stock prices, that is, if prices are rising, but OBV is decreasing and vice versa, we have a signal for a potential change in trend.
Alternatively, a stock price that is in a trading range and OBV breaks into a new high or low, this can indicate a breakout in the stock price and in which direction.
As we can see from the following chart, combining the OBV with Bollinger Bands can help provide good signals. The Bollinger Bands provide us with an anticipated breakout due to volatility. OBV gives us a gauge of buying and selling pressure behind the stock through volume analysis.

In this lesson, we have introduced you to the concept of using Indicators for decision-making on entry and exit points for trading. We introduced you to the key indicators: Moving Average, RSI, Stochastic Oscillator, Bollinger Bands and On Balance Volume, and how they can be used to define timing of entry and exit.