
Module 4 – 41 Applying Fibonacci Price Levels.
Applying Fibonacci Price Levels
We’ve covered the Gann’s theory completely, so it is time to discuss the Fibonacci Price Levels. If you are a beginner, you wouldn’t know about Fibonacci Price Levels. But if you are at the intermediary level, you might know about this. Anyway, we’ll explain what it is and how you should apply Fibonacci Price levels.
Definition of Fibonacci Retracement
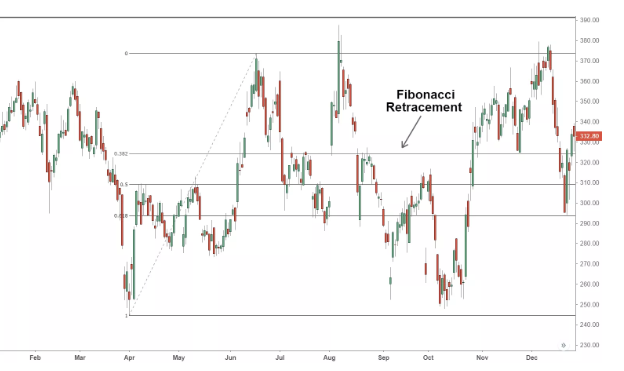
In technical analysis, Fibonacci retracement is famous, and they are referred to the support or resistance areas. The Fibonacci retracement levels help the traders to identify possible resistance and support levels using horizontal lines. There is a percentage involved with each level. The percentage indicates the prior move of the price retraced. The levels of retracement are 38.2%, 23.6%, 78.6%, and 61.8%. However, 50% is also considered even though it is not an official ratio.
The indicator is beneficial as it can be used to construct any main price points, including a low and a high. And then, using the indicator, you can build the levels between the points.
If the price increases $10 and then reduces $2.36, it means that retracement is 23.6%, and this is a Fibonacci number. You can Fibonacci numbers through nature, and this is why traders assume these numbers are relevant to the financial markets.
Fibonacci Retracement Levels’ Formula
There is no formula for the indicator itself. The indicator is applied, and then the trader chooses a pair of points on the chart. Once the points are selected, the lines will be drawn at percentages based on the move.
For example, if the price increases from $10 to $15, and if they are selected as the two price levels, the retracement indicator will be drawn here at 23.6%.
Calculation of Fibonacci Retracement Levels
As mentioned, you can’t calculate anything when dealing with Fibonacci retracement levels. Instead, they are percentages based on the price range selected. Well, if you are wondering the entrance of these numbers, they are from Golden Ratio. These numbers are based on Golden Ratio.
If you keep adding numbers with zero and one and move to add before two numbers, it is apparent you will get something like the following sequence:
0, 1, 1, 2, 3, 5, 8, 13, 21, 34, 55, 89, 144, 233, 377, 610, 987…
However, the Fibonacci retracement levels are created using the number string. If you avoid the first few numbers, and focus on one number and divide it by the second numerical value on its right, you will get 0.618, in percentage, it would be 61.8%. Similarly, you will get Fibonacci numbers, except 50%, as it is not official. So some mathematical calculations deal with this procedure along with the number string.
Like mentioned before, naturally, we find Fibonacci numbers. For example, the Golden Ratio of 1.618 is seen in galaxy formation, sunflowers, historical artifacts, shells, and architecture.
Why use Fibonacci Retracement Levels
There are different uses of Fibonacci retracement levels. The technical analysts cannot do without these levels because they are essential. However, one can use Fibonacci retracements to decide the stop-loss levels, place entry orders, or to set target price.
For example, consider a trader is witnessing stock moving upwards (higher). After the upward move, it retraces at 61.8% level and bounces back. As the bounce happened at a Fibonacci level, the longer the trend prevails, the trader will decide to buy. Or the trader can place a stop loss at a 100% level or 78.6% level.
There are other forms of technical analysis, in which Fibonacci levels are used. For example, you can see them in Elliot Wave theory and Gartley patterns. These technical analyses will reverse when they find the retracement, and the reversal will occur near Fibonacci levels (most certainly). However, as you already know, this will happen when the price moves up or down significantly.
When you compare moving averages to Fibonacci retracement levels, you must know that Fibonacci retracement levels do not change. The static nature helps in easy and quick identification. Due to these factors, investors and traders can act prudently on the tested price levels. So, these inflection points mean the expected type of price, break, or rejection.
Limitations of Fibonacci Retracement Levels
So far, you have learned the positive aspects of Fibonacci retracement levels, but you must be aware of the limitations as well. Even though these levels help the traders to find where the price will meet support and resistance, there is no guarantee that it will happen. Because of this limitation, other confirmation signals are introduced.
Another limitation of Fibonacci retracement levels is its abundance. There are several levels so that the price might reverse near any level. So the problem is in finding the ideal retracement to be used in their process of analysis.
Wrapping up
A beginner needs a lot of practice and more learning, so if you are a beginner, continue educating yourself. However, Fibonacci price levels aren’t difficult to understand if you grasp the basics. Hence, lay the basement correctly!