
Module 4 – 44 Trading using price analysis.
Trading using price analysis
If you are learning to trade, you can’t avoid price analysis because it is a crucial part of trading. Without price analysis, you will not be able to make a clear decision. Therefore, we will help you learn price analysis and the ways to use it in trading.
Definition of Price Action Analysis
As for famous analysts, price action analysis means the steps of reading, studying, and analyzing price movement of markets within a specific period. This involves raw price charts, sans indicators to trade the market. If you learn to read price action, you will be able to determine the directional bias of the market and recurring price action setups and patterns or market continuation.
In other words, you are using the raw price movement to study and trade the market. Your decisions will be based on the indicator-free or naked price bars. It is apparent that economic variables impact price movement that can be visibly seen on the price charts of the market. Even if the variable is filtered through a computer or a human trader, the price movement created can be seen on a price chart.
Hence, instead of trying to learn and understand millions of variables every day, you can learn price action analysis. You can trade off the price action if you have studied it thoroughly. So why not make use of this analysis in trading?
How to apply price action analysis in trading
When you are applying price action analysis in trading, you should remember that you don’t have to restrict it to one market. Instead, you can use it in any market as it uses the price data, which is the core part of every market.
You will be benefitted better if the market is more volatile because only then directional trending will allow price action trading to show its colors. If you utilize the time-tested price action setup, you can trade excellently. You don’t have to find different price patterns because there are a few useful price patterns that will help you make the most out of the market. If you stick to those effective price action setups, you can enter into profitable trades.
When you are applying price action analysis on a chart, you must make sure to keep it clean. You shouldn’t keep the chart crowded with all the indicators because it will not be a positive impact on the price action analysis. For example, you can select a black and white chart whereas only price action will be in a different color. However, the following example is a daily chart set up in a market:

That being said, let’s check out an example of a simple price chart and chart with popular indicators that some traders prefer using. We want you to understand the difference between these charts. By doing so, you will be able to find the logical chart to use when trading the financial markets.
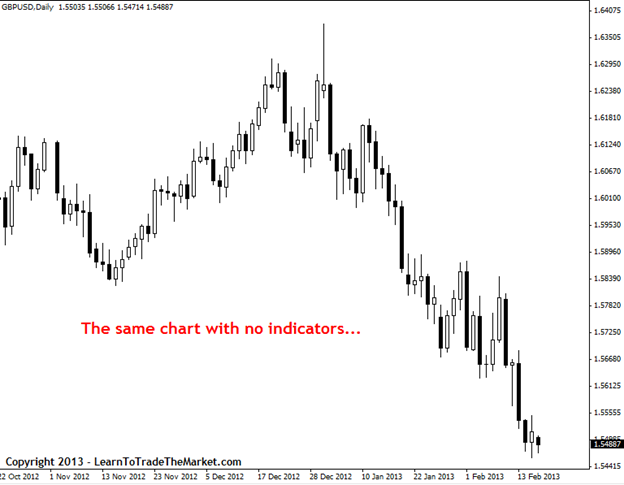
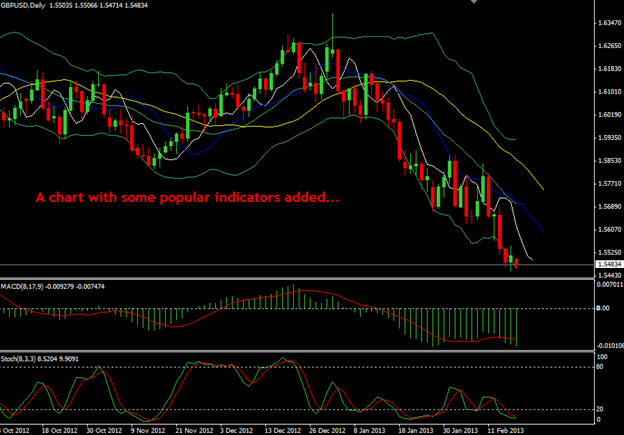
Once you look at the charts above, you will understand that it is insane to hide the most visible price action using other indicators. In fact, by doing this, you are making the chart confusing and complicated. However, indicators are obtained from movements of price, so when you have something direct like the price action analysis, why would you use other indicators? It makes sense to use the primary data than to use the secondary data.
Definition of price action
Now that you know what price action analysis means, it is time to take a closer look at price action alone. This means the security’s price movement indicated over time. The basis of technical analysis for every market in the financial industry is price action. Short-term traders have a great interest and trust in price action. They use this analysis to explore trends, trade formations, and much more. Price action is a derivative of technical analysis since it can be used in studying past prices during decision making. Now That you know what price action means, let’s see what price action analysis means.
Price action informs the following
After learning the definition of price action, you must consider the factors that it tries to inform you. Traders accommodate different compositions of charts to enhance their skills in interpreting and spotting trends, reversals, and breakouts. Most traders prefer using candlestick charts as they have enhanced visualization in regards to price movements. They display low, high, close, and open values in up or down sessions.
Some of the enhanced visualizations of price action are:
- Three white soldiers
- Engulfing patterns
- Harami cross
However, you can find many more candlestick formations that are created off price action to offer what the traders must expect next.
Besides visual formations, technical indicators are calculated using the price action data. The aim is to find an order in the random price movement that sometimes happens. That said, you can now apply price analysis in trading!