
Module 5 – 48 Understanding accumulation and distribution.
Understanding accumulation and distribution
We know if you are a beginner, you might not know these terms. But who enters the market by learning A-Z, nobody, right? So, you shouldn’t worry if you don’t know these terms. We will explain these terms and help you understand them better.
What does accumulation distribution mean?
Accumulation Distribution utilizes volume to make sure the price trends or to warn about the weak movements that might lead to a price reversal. Therefore, these terms are a must for traders.
- Accumulation: the volume is accumulated in a situation when day’s close overpower and becomes higher when compared to the previous day’s closing price. Hence, it is an accumulation day.
- Distribution: the volume is distributed in a situation when the day’s close doesn’t overpower and becomes lower than the previous day’s closing price. Hence, it is a distribution day.
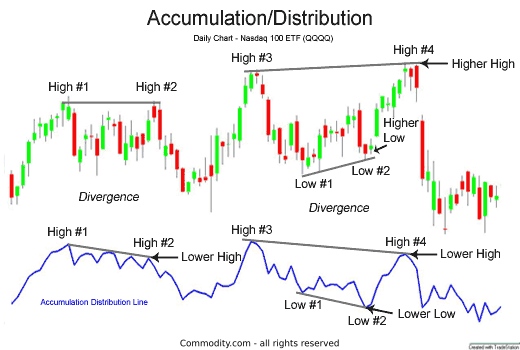
Thus, in an accumulation day, the volume of the day is summed up with the Accumulation Distribution Line o the previous day. Similarly, in a distribution day, the volume of the day is deducted from the Accumulation Distribution Line of the previous day. The major importance of the Accumulation Distribution Line is to identify the divergences between the volume movement and price movement. If you check the chart below, you will find an example of the Nasdaq 100 exchange-traded fund QQQ that explains the Accumulation Distribution Line.
Accumulation/Distribution Indicator shows the following
So, now that you have learned the meaning of the terms let’s dig deeper into it. What do these terms actually tell you? Well, you can understand the ways how demand and supply impact the price if you use this indicator. A/D can move in favor of or against the changes in price. This means, sometimes, it may move in the right opposite direction to price changes.
You can understand the capacity of buying and selling in a certain period by using this multiplier because it helps you in calculating. The multiplier focuses on the close of price in the lower or upper portion of the range to determine it. Then, the volume is used in multiplying it. Hence, for example, if a stock closes near the high range of a period, the volume will be higher, and it will provide a significant A/D jump. But if the closing price happens near the high range, while the volume is low, the movement of the A/D will not be higher. Then again, if the price closes toward the middle range and volume is high, the movement of the A/D will not be as much.
The same applies if the price closes in the lower portion of the price range of the period. The rate of declining of A/D is decided by the volume of the closing price in a period’s range.
You can assess the forthcoming reversals and price trends using the accumulation/distribution line.
If the accumulation/distribution line is located in an uptrend while the security’s price is located in a downtrend, the effective indicator will display the buying pressure and the chances for the upside reversal of the security’s price.
Similarly, if If the accumulation/distribution line is located in a downtrend while the security’s price is located in an uptrend, the effective indicator will display the higher distribution or selling pressure. This means the warning about the price in regards to the decline.
In both situations, you can gather insights about the trend by using the accumulation/distribution line. Basically, a steadily rising price is confirmed by the steadily rising A/D line. Also, a falling price is confirmed by a falling A/D. However, there are prices and distribution that might still continue in the declining process.
Accumulation/Distribution Indicator’s limitations
You can’t find the price changes from a period to another by using this indicator because it doesn’t do it. Instead, you can only get the prices close within the range in the current period.
Another pro factor of this indicator can also be treated as a con. Yes, the divergences can sometimes be treated as a con. Divergences might last for a prolonged period but might offer sparse timing signals. It is not said that the reversal is going to happen when the divergence occurs between the price and indicator. Sometimes, the price might reverse after a long time, or it might not reverse. Even though A/D is an effective tool to find insights in a trend, it is not flawless.
It is advisable to use this indicator along with other analyses, including chart patterns, price action analysis, and much more, to get an accurate decision in trading.
Wrapping up
As we have explained everything related to accumulation and distribution, you might have got a clear picture of them. However, remember, it is one of the effective tools that help the traders to determine price action while warning potential price reversals. If you want to incorporate price analysis and volume, you can do it by Accumulation Distribution Line.
Anyway, as we said before, in trading, you should always keep looking for more information. Sometimes, you might find better indicators than this, so if you do, make sure to practice them in trading.