
Module 5 – 49 Continuation patterns.
Continuation patterns
The next essential chapter that we must discuss is continuation patterns. As we’ve been repeating, in trading, you will not be able to become an expert unless you learn every nook and corner. Yes, educating yourself is essential if you are taking part in the financial market. However, let’s get started with understanding the continuation pattern.
Definition of Continuation Pattern
The traders can find the direction of the price using the price continuation pattern. This pattern suggests the price movement after a pattern completes. Technical analysts and those patterns use many other continuation patterns also help the traders to find the continuation of the price trend.
Some of the patterns are pennants, rectangles, flags, and triangles. However, you must understand that you can’t find continuation patterns that will offer a 100% result concerning the trend. Sometimes, there can be reversal results. To trade using continuation patterns, you need to learn it in depth. Here we go.
What is a Continuation Pattern?
This is considered as such due to its ability to continue with the same trend even after the completion of the pattern. The price action context is the reason for this assumption. As mentioned before, there are instances when the continuation patterns may not result as expected. For example, there might be a price reversal after the pennant or triangle formation.
However, the continuation pattern is treated reliably if the trend is moving towards the steady pattern. Also, the pattern must be smaller when compared with trending waves. If you consider an example, when the price increases steadily, the tiny triangle pattern is formed, and then, it is broken above the pattern of a triangle while moving higher.
Some of the signs for opposing the trend are:
- The preceded trending waves are less prominent compared to the continuation pattern
- Lacking trending direction’s conviction
- Increased volatility
- Moves are more significant when they are opposite to the trend
However, along with all these, you should also be careful with minor trending waves that tag a continuation pattern. You can’t rely on a continuation pattern that inches above, and a continuation pattern is created, and then, again inches higher, and then continues the pattern. But you can rely on a continuation pattern that moves higher and forms the pattern. If you look at the second, it defines buying strength, while the former defines that buyers are not ready to let prices up.
If you want to be successful in using this, you must focus on the trading technique of waiting. You must wait until the pattern forms, create trendlines considering the pattern, then, and consider a trade at the price break (in the prevailing trend). Now that you have understood the in-depth view of the continuation pattern let’s take a look at the types of Continuation Patterns.
Continuation Patterns Types
As we discussed, some of the continuation patterns are pennants, triangles, rectangles, and pennants. So, let’s understand them briefly.
Triangle- When price action becomes more compressed in security, it forms a triangle. The three types, such as symmetrical, descending and ascending.
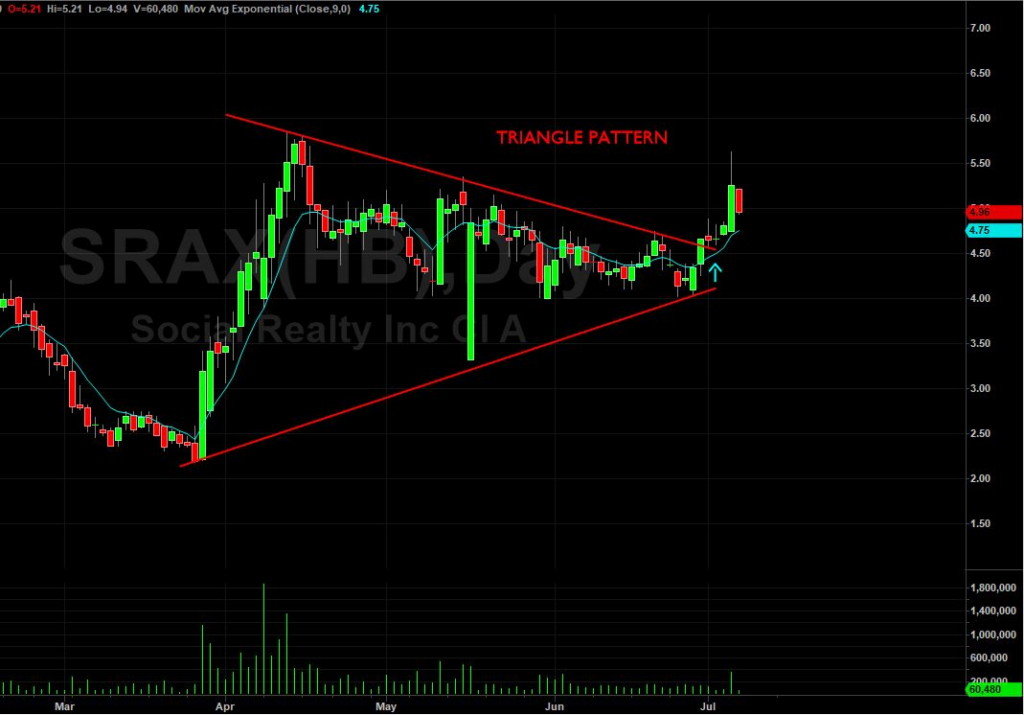
- Ascending swing lows and descending swing highs create a symmetrical triangle. This forms a rising and descending trendline that converges toward one another.
- Swing highs in a descending triangle and will be declining by creating a sloping trendline that is downward once connected. Similarly, swing lows come to the same levels creating a trendline, which is, horizontal once they are connected.
- An ascending triangle is created by rising swing lows forming an ascending line once they are connected. Swing highs reach the same level, forming a horizontal trendline once they are connected.
However, it is essential to have two swing lows and swing highs to form the trend lines that are required for drawing a triangle. Sometimes, a third or fourth, swing low or high, is regular prior to a breakout.
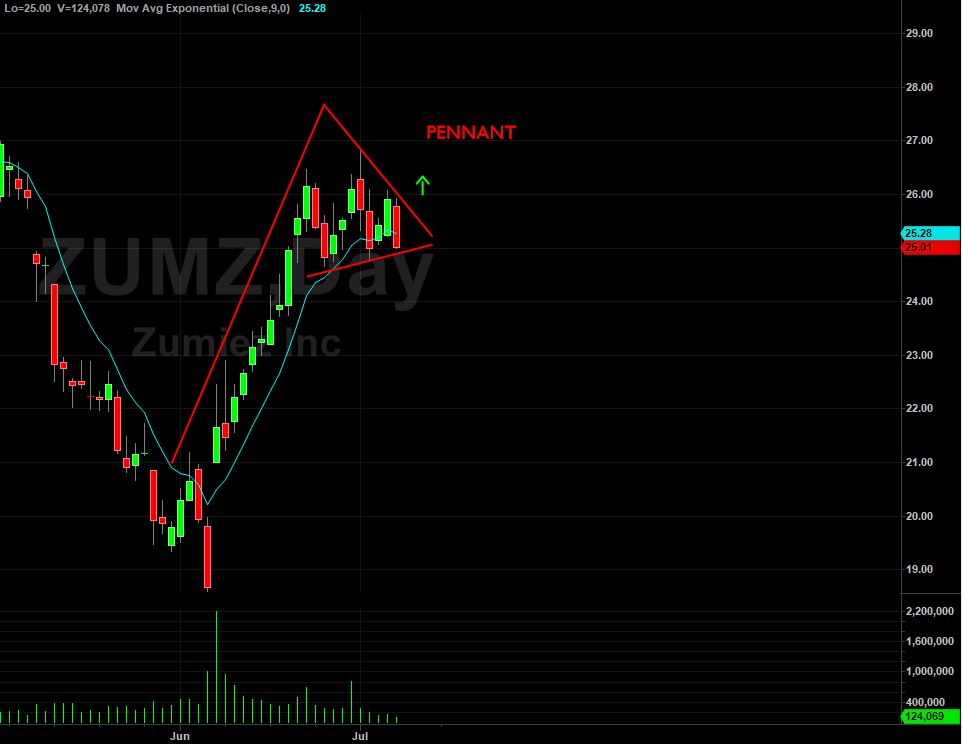
Pennants- these are triangles, but are smaller in size. Anyway, swing lows and highs are in the triangle when price oscillates to and fro. But, pennant appears as a consolidation or narrow price range, which becomes smaller with time. These are created by a price that is sharp in decreasing or increasing and define that the market is following a breather prior to breaking out once again.
Flags- these are like pennants. After a strong price decrease or increases, a smaller trading range will be formed by creating flags. There is a difference, and the flags will move between the parallel lines, descending, ascending, or sideways. Meanwhile, the pennant will make a shape of triangle.

Rectangle- this is a regular pattern of continuation that displays the trending price’s paused situation when price action goes sideways. Anyway, price action will be confined between horizontal resistance and support levels.
Conclusion
That said, we have discussed the continuation patterns in detail. If you are utilizing continuation patterns in trading, it is essential to focus on the above types and definitions. Next, let’s discuss Trading using reversal signals and patterns.