
Module 5 – 50 Trading using reversal signals and patterns.
Trading using reversal signals and patterns
After you have completed the continuation patterns chapter, you can then learn about Trading using reversal signals and patterns. Reversal signals and patterns are essential in trading because they have the power to make or break the traders’ journey. Most beginners lose their positions because of not understanding reversal signals and patterns, so let’s begin learning it.
Identifying reversals
Before you learn the reversal signals and patterns, you must know the difference between reversals and retracements. It would be best if you distinguished them so that you can clearly understand what they are. Like we mentioned earlier, by following retracements and reversals, you can avoid losing trades while taking up more winning trades. If you want to find a long-term trend reversal, you must consider the following:
- Reversals can happen at anytime
- The long-term price movement
- Fundamentals will not change
- In a downtrend, low interest for selling make the price to rise higher, and in an uptrend, low interest for buying make the price to fall lower.
Understand when to enter the market
If you know when to enter the market, you don’t have to worry about anything else. But the problem is with understanding the way to enter the market. If you want to hold on to the maximum price swing, you must enter the market when the trends are emerging. To understand the time to enter the market, you should consider the potential reversals.
Forex Reversal Patterns
If you consider the chart patterns, it is easy to understand the attitude of the participants of the market concerning a currency pair. For instance, if one of the major market players assume that a level will hold and protect the level, you are likely to witness a price reversal at that particular level.
You can forecast the high probability reversal zones using the reversal patterns. You might encounter a single candle, group candles, or a large structural chart pattern. However, you should understand that each chart formations offer a particular reversal potential. Most traders who are experienced tend to focus on these to gain early entry.
Types of reversal chart patterns
You already know the bearish and bullish patterns. However, even in reversal chart patterns, you can encounter bearish and bullish reversal patterns.
- The current bearish move might be reversed into the bullish direction in a bullish reversal pattern.
- The current bullish move might be reversed into the bearish direction in a bearish reversal pattern.
Once you understand all these, you have to learn then the essential reversal patterns, which are candlestick reversal patterns.
Top patterns related candlestick reversals
We will mention the popular candlestick reversal patterns that you can consider when trading the financial markets.
Doji Candlestick Pattern
This is one of the famous candlestick patterns that successful traders know. As beginners, you should also be aware of this pattern. You can understand the structure of this pattern very easily, as it is simple.
Moreover, this is a single candle pattern. This candle is created when closing and opening prices in a certain period are similar. So Doji doesn’t have a body, it is just across. This pattern might occur after a long price move or when the market has no volatility and very quiet. In both cases, the pattern will close where it opened or closer to it.
This pattern is associated with market exhaustion or indecision. When the pattern forms after an extended trend move, you can encounter strong reversal potential. The candle shows the trend riders’ inability to force the price in a similar direction. The forces between bulls and bears start to become similar and automatically reverse direction.

The above picture shows the Doji candle as a bearish reversal signal. Witness that price action moving is the bullish Doji candle but the pressure beginning towards upside tending to stall as proven by the Doji candle and the two candles before the Doji candle. After the Doji appearance, the trend reverses, and the price action begins to become bearish decent.
Hammer Candlestick Pattern
This is another candlestick pattern with a reversal function. This candle has a small body, non-existent or small upper shadow, and a long lower shadow. The Hammer pattern will be valid if the reversal signal happens during a bearish trend.
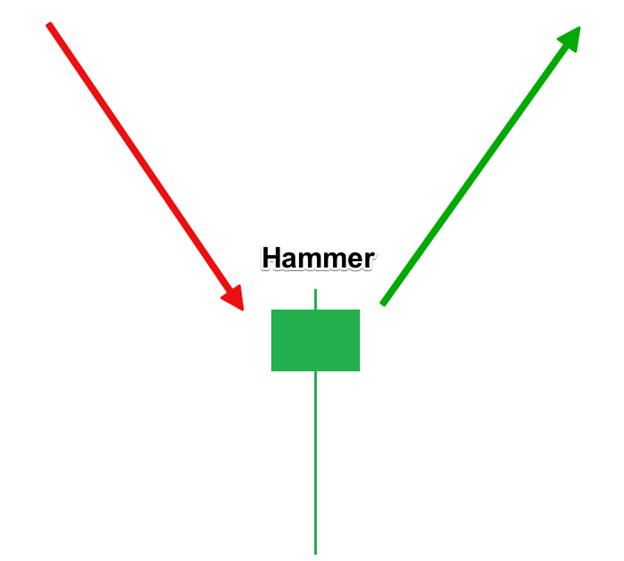
The sketch indicates how the condition should be to confirm Hammer’s reversal. Note that the hammer candle itself might be bearish or bullish, and this fact will not change the function. There are variations of the candle as for the trend and the structure of the candle.
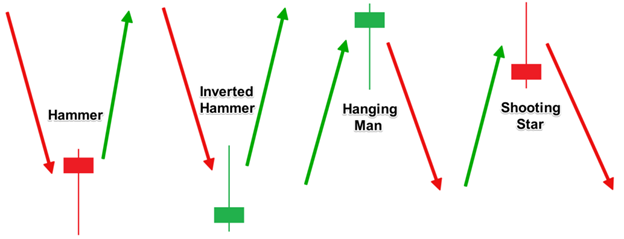
The first two instances show a bearish trend that reverses into a bullish price move. The difference is the long wick in the second instance that is turned towards the opposite direction. This is called Inverted Hammer.
The second two instances show a bullish trend that reverses into a bearish trend. It will be a Hanging Man if the lower end shows a long shadow.
So a Shooting star is when the upper end shows long shadow. However, in all four instances, the reversal candle doesn’t necessarily need to be bearish or bullish.
Conclusion
That said, you should remember that there are many more reversal signals and patterns that you need to learn. Therefore, you can’t end learning here.