
Module 5 – 51 Trading using volume and reversal patterns.
Trading using volume and reversal patterns
After you have learned the reversal signals and patterns, it is a must to think about trading using volume and reversal patterns. Therefore, we have included this chapter in our course. Let’s begin learning it.
Defining volume
Before you trade using volume, it is essential to understand volume. Volume is used to measure the rate concerning the traded financial assets in a given period. In particular, it is to check the buying and selling rate of the asset. Even though this is a powerful indicator, traders often overlook this factor because of its simplicity. You can find information related to the volume from anywhere. However, the problem is with using it. Only a very few traders or investors know the exact way of using volume to increase returns while decreasing risk.
All sellers in the market need a person to sell the shares they purchased to create a trade. Similarly, every buyer needs a seller. This is a two-way thing. However, this war between sellers and buyers looking for the best price in different time frames forms short-term price movements. Meanwhile, fundamental and longer-term technical factors do their part. So, using volume in trading will help the traders to reduce risk while increasing the profits.
Guidelines for Using Volume
When considering volume, you can use the guidelines to decide the weaknesses and strengths of a move. You will not be ready to join weak moves, but strong moves, and that’s a right decision. Or you might even look for the opposite direction of a move that is weak. However, when following these guidelines, you should remember that they are not 100% accurate in all situations. But you can apply these guidelines generally to make your trading experience better.
Market Interest and Volume
If it’s a rising market, it should have a rising volume. Buyers need increasing interest and numbers to push the prices higher. If the price is increasing and volume is decreasing, it means the interest is lacking. This situation will create a potential reversal, and it’s a warning. You need to understand that when the price rises or drops on a little volume, you shouldn’t consider it a strong signal. But when the price rise or drops on a large volume, it is essential to treat it as a strong signal. This is an indication of fundamental changes.
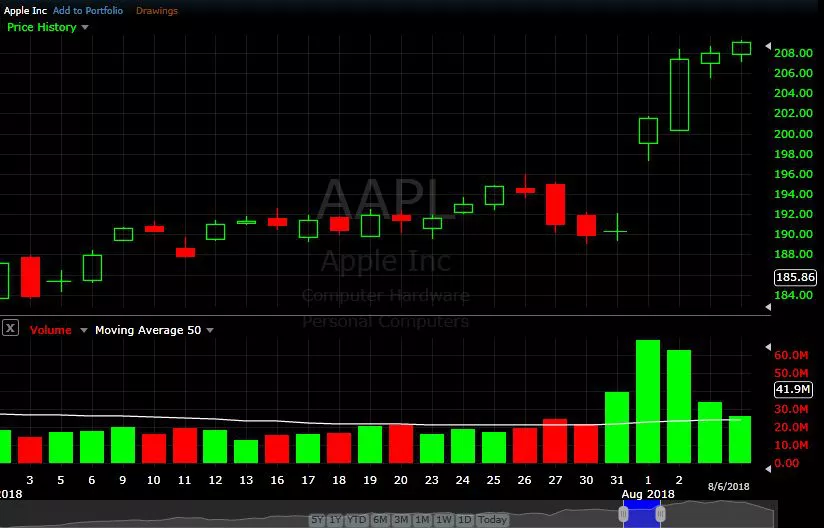
Exhaustion Moves and Volume
You will encounter exhaustion moves in a falling or rising market. These moves are a combination of sharp price moves and an increase in volume; this is a signal for potential trend end. The participants who are exhausting the number of buyers are the ones who are afraid of market tops.
In a market bottom, a large number of traders will be forced out because of the falling price. This will result in increased volume and volatility. After the spike, you will encounter a decrease in volume. However, you can still find how volume playing using the necessary guidelines.
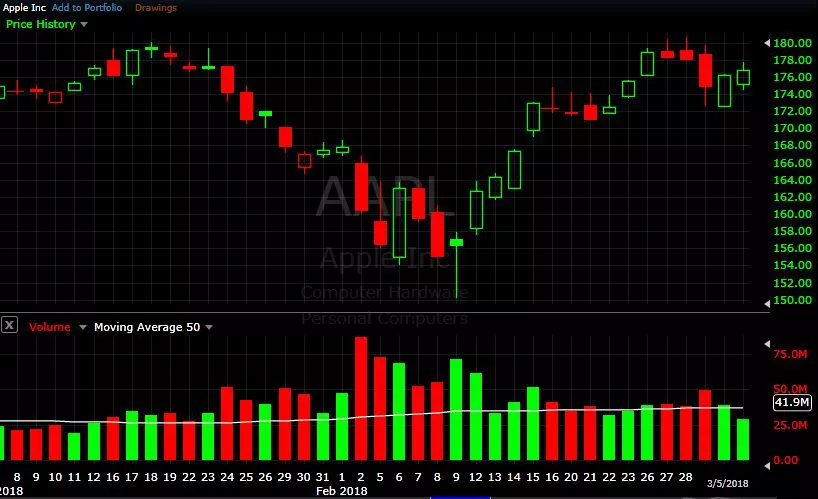
Bullish Signs
If you are identifying bullish signs, the volume can be instrumental. For example, consider a declining price, if volume increases, and then the price moves higher, along with a move back lower. The price that moved back lower remains higher the prior low, and also volume gets diminished in the second decline, so it is considered a bullish sign.
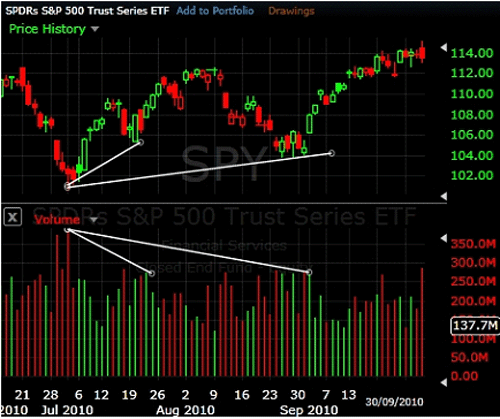
Price Reversals and Volume
Reversal is when a long price moves lower or higher, and if the price starts to range with massive volume and little price movement.
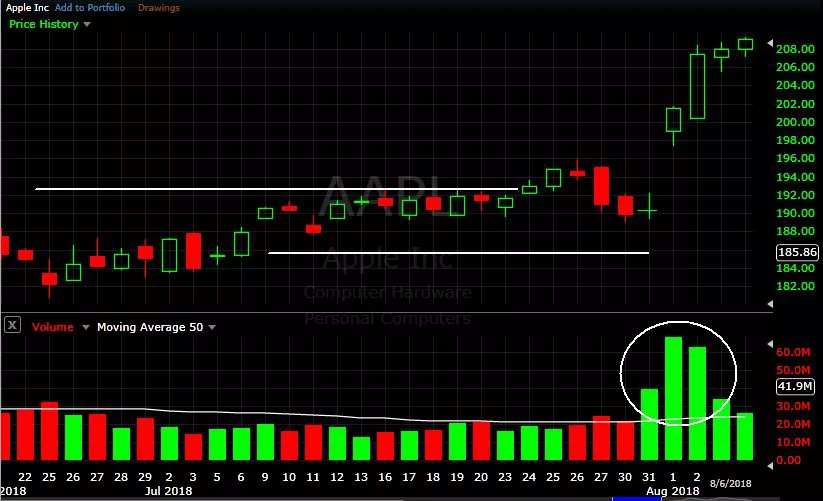
Breakouts vs. False Breakouts and Volume
Initial breakout from a chart pattern or range indicates a rise in volume, so it shows strong moves. However, declining volume or change in volume on a breakout shows a lack of interest and an increase in a false breakout.
Volume History
You must consider the recent history when dealing with volume. If you compare today’s volume to years back data, then you are not going to be benefitted. If the data is recent, then it is highly relevant.
Volume Indicators
You can find volume indicators in the common charting platforms. They are mathematical formulas visually presented to make things easier for traders. Every indicator uses different formulas, so traders must utilize the most suitable indicator for the market they are approaching. It is not a must to use indicators, but you can seek guidance using indicators. There are volume indicators, so make sure to utilize them when trading. Some of the volume indicators are On-Balance-Volume (OBV), Chaikin Money Flow, and Klinger Oscillator.
Conclusion
By now, you would have understood that volume is a useful tool. Even though it is not a price action tool or something similar, you can still benefit from it. You can’t identify the entry or exit of trade, but volume can make things simpler for you.