
Module 5 – 52 Candlestick patterns.
Candlestick patterns
If you want to become successful in trading, you need to have a proper understanding of candlestick patterns. They are the integral parts of trading that you can never overlook. However, most beginners have no interest in learning candlestick patterns even though without it, you can never make it work. Therefore, we will help you get things done through our course. This chapter will cover the necessary factors related to candlestick patterns.
Understanding candlestick charts
Among the technical tools, candlestick charts pile up data for many time frames concluding to one price bars. Therefore, these are more beneficial than traditional low-close bars, simple lines, or open-high which attach the closing prices’ dots. Candlestick creates patterns that help to predict the direction of the price once completed. This technical tool becomes extra special with color-coding added by Japanese traders.
Reliability of Candlestick Pattern
So now that you assume a candlestick pattern as one of the best technical tools, it is not the case. There are cases when candlestick patterns won’t perform well. The reliability of candlestick patterns has lowered because of their popularity. The reason is because of the deconstruction done by algorithms and hedge funds. The players who are the well-funded ones focus on high-speed execution, in order to, do trading against fund managers who are traditional and retail investors.
In better words, the software is used by the managers of the hedge fund to trap participants of the market searching for bearish or bullish outcomes of high-odds. Nevertheless, you can encounter reliable patterns that continuously appear, letting in long-term or short-term profit chances.
When learning candlestick patterns, you need to be cautious about the major patterns of the candlestick that work exceptionally while acting like precursors of momentum and price direction. Each works by predicting lower or higher prices within the area of price bars. However, they are time-sensitive in two different ways, such as:
- First, they focus only on the restriction of daily, monthly, weekly, or intraday monthly chart reviews.
- Second, after the completion of the pattern, the potency will rapidly decrease 3-5 bars.
Must-know Candlestick Patterns
The following analysis is based on the book “Encyclopedia of Candlestick Charts,” Thomas Bulkowski wrote that in 2008. The book was about the candlestick patterns’ performance rankings. Two types of pattern outcomes mentioned by the writer are continuation and reversal. The continuation patterns predict the extension, which is in the current direction. The candlestick reversal patterns analyze the change in the price direction.
The below examples, opening print is lower than the closing print donated by a hollow white candlestick. Closing print, which is lower than opening print, is denoted by a black candlestick.
The Pattern of Three Line Strike
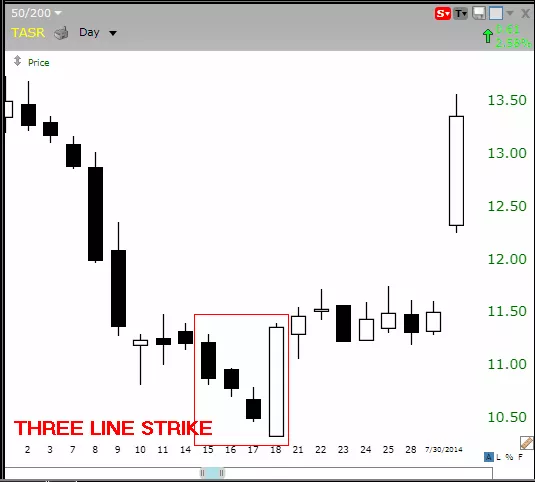
Three black candles that are within a downtrend are carved by a reversal pattern of a three-line strike, which is also bullish. Near the intrabar low, a lower low is denoted by each bar. The bar that opens lower but reverses is the 4th bar in an extended-range, which is the outside bar. This closes above the first candle’s high, and this will be in the series. The print of opening denotes the fourth bar’s low. As per the writer, this reversal analyses higher prices along with an accuracy rate of 84%.
The Two Black Gapping
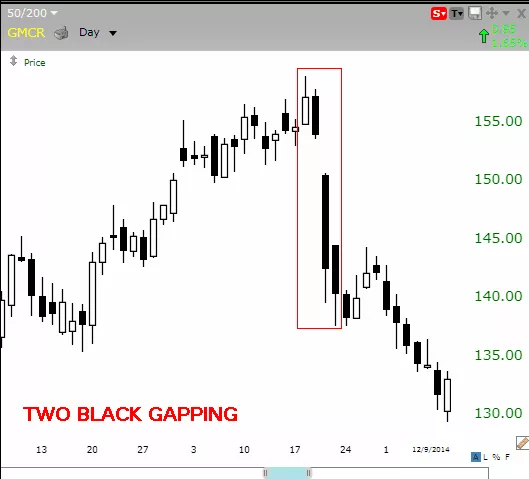
Only after an uptrend’s notable top, continuation pattern of two black gapping appears, which is also bearish. Plus, the gap down creates two black pars displaying lower lows. Two black gapping pattern shows declining will go on to lower lows while triggering a wider-scale downtrend. As per Bulkowski, two black gapping analyses lower prices along with an accuracy rate of 68%.
The Three Black Crows
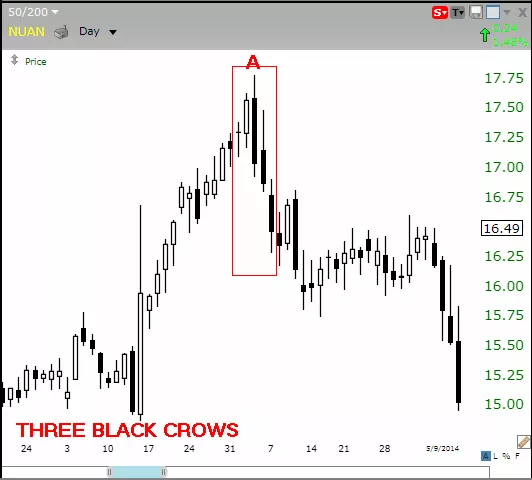
This reversal pattern begins near or at an uptrend’s high; also, this is a bearish three reversal. These three bars display lower lows which end near the lows of intrabar. Three black crows shows declining will continue also to lower lows while triggering a downtrend of wider-scale. The highest bearish version will begin at a high which is new as it traps the buyers (the ones who deal with momentum plays). As per Bulkowski, three black crows analyses lower prices along with an accuracy rate of 78%.
The Evening Star
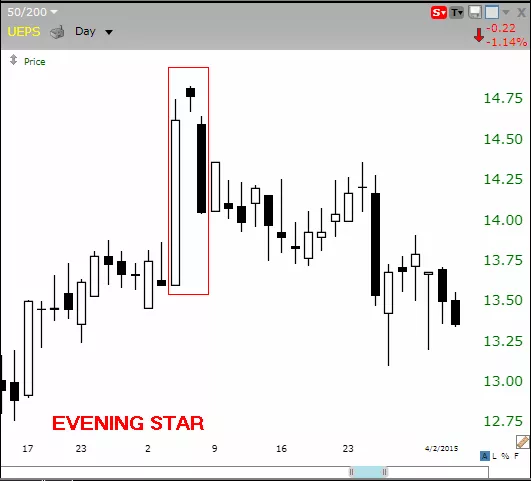
The bearish evening pattern begins with a white bar, which is tall. Also, it tags an uptrend that leads to a high. During the next bar, the gaps in the market increase, but new buyers lose the chance to enter, making a small range candlestick. However, the pattern gets completed after the third bar’s gap downs. And this will predict the declining will continue also to lower lows. So, a wider-scale downtrend is triggered. As per Bulkowski, Evening star analyses lower prices along with an accuracy rate of 72%.
The Abandoned Baby
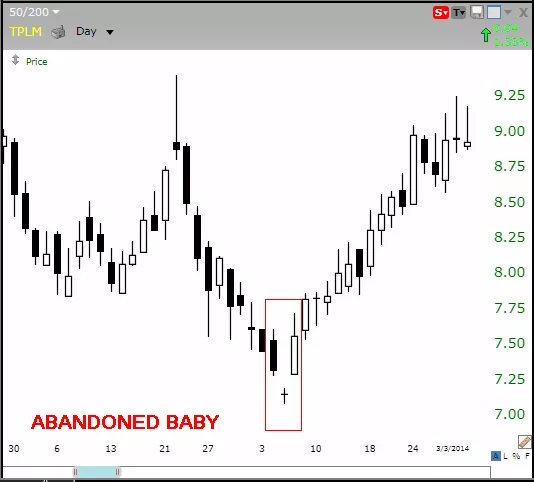
A downtrend’s low is the place where this bullish reversal pattern creates. This happens only after lower lows of black candles print that is after a series of those candles. In the bar which appears next, you can witness the way the market gap reduces. However, new sellers lose the chance to enter, creating a small range of Doji candlestick. This will be with closing and opening prints at a similar price. The pattern will be completed after the bullish gap that occurs in the 3rd bar. This predicts the extension of recovery to higher highs. Hence, a wider-scale uptrend will be triggered. As per Bulkowski, Abonded baby analyses higher prices along with an accuracy rate of 70%.
Wrapping up
Concluding, market players consider candlestick patterns as one of the best tools. However, as mentioned above, you need to be aware of continuation and reversal as they don’t work all the time reliably. That said, you can still use candlestick patterns in trading.