
Module 5 – 54 Reversal Patterns.
Reversal Patterns
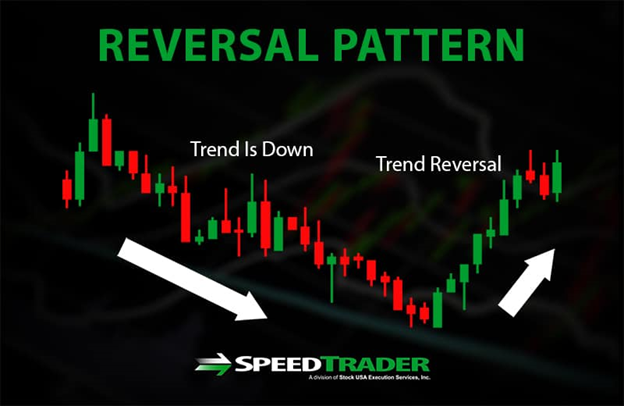
We have covered candlestick patterns, so it is time to talk about reversal patterns. Do you know reversal patterns? You would have heard of reversal patterns. So, it means the price trend of the stock will change its direction, and also it is the prevailing direction which is considered here. If the price of a stock has been rising for a specific time, days, hours, or months based on the period of the chart that you are considering, a reversal pattern happens when the price starts to go low for a certain period.
Lows and highs of the price tracking the reversal will be less than lows and highs before it. You will witness this pattern if the downtrend ends while the price of stock stars rising and creating higher highs. You can use the candlestick charts to identify the bearish and bullish reversal patterns so that trading them becomes more comfortable.
You must remember that technical analyses don’t guarantee a 100% result. Just like that, you cannot rely on indicators that ensure reversal pattern continuation or occurrence. If you don’t want to lose badly, make sure to place limits or stop losses when necessary. If you are interested in reversal patterns, know that it takes a high level of patience and practice, so you should do the needful to protect your place in case a reversal doesn’t continue or occur.
As you have understood what reversal patterns are, let’s learn the bullish and bearish reversal patterns in detail.
Patterns of Bullish Reversal
Bullish Engulfing
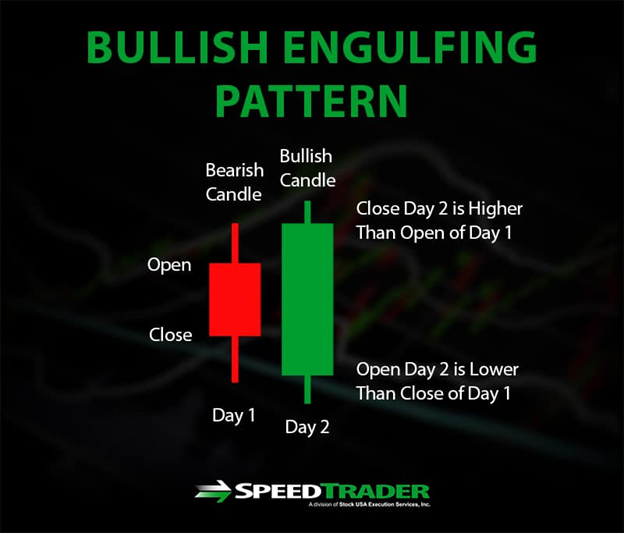
When a pattern signs a reversal to an uptrend from stock price’s downtrend, it is called bullish engulfing. This happens when candlestick of the current day engulfs or overshadows the candlestick of the previous day. This indicates that gapped down stock in trading of pre-market, lowering current candlestick’s bottom of the previous candlestick’s bottom. The price of a stock might reduce throughout the day, however, it mostly ends in the higher high of the previous day so the top of current candlestick is greater than the upper wick of the previous candlestick.
This pattern shows that selling off sooner within the day or pre-market has been substituted by purchasing activity, moving the stock price above the high of the previous day.
You can witness signaling a pattern of reversal when the closing price is seen closer to day’s highs resulting in candlestick’s minor upper wick. Plus, the following day’s closing price must be pushed more to indicate the continuation of the reversal.
Piercing Pattern
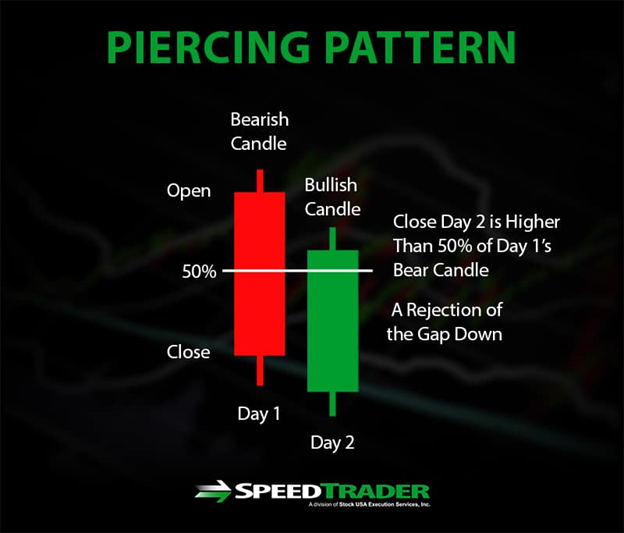
This is like bullish engulfing, however, the bullish reversal signal is less aggressive. Piercing pattern needs gaps down in the opening price of the current day below the low of the previous day. Therefore, it will rise throughout. The closing price is located above the middle point among the closing and opening price of the last day to signal this pattern. This is a part of the former day’s losses regained by the present close.
While you can’t consider this as a sign for reversal continuation if downtrend previous was extended and strong, consider this a positive sign that purchasing activity has overcome increase demand and selling pressure. However, it is wise enough to search for an extended price increase on the next day or an increased volume of trading before focusing on purchasing.
Bullish Harami
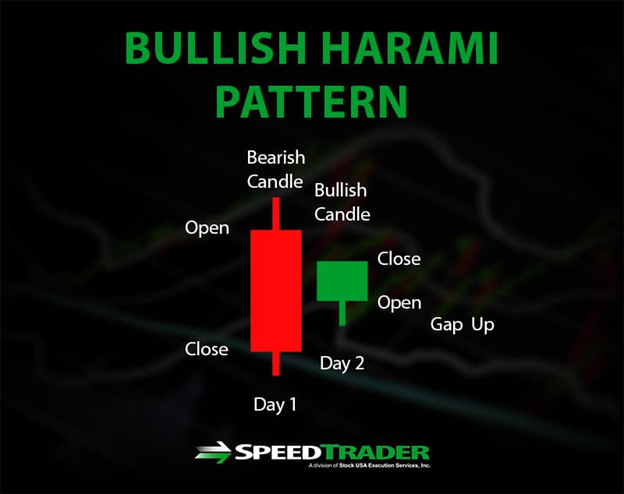
This is when the stock price gaps up when trading pre-market and halts above the market close’s opening level. Even though it is not essential to end upon the opening price of the previous day. However, to get the Bullish Harami signal a good price action is essential after gapped-up open. If you encounter the breaks of the closing price that are upon the trendline in the previous period of a downtrend, then a reversal continuation is signaled by this pattern. This is a good sign to buy.
Patterns of Bearish Reversal
The Bearish Engulfing
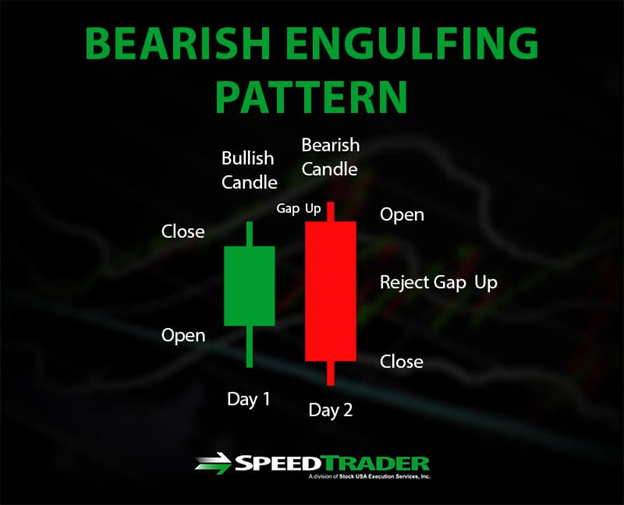
This is the opposite of bullish engulfing. This adds a bad candlestick which completely eclipses the positive candlestick of the previous day. This needs a price gap up. Therefore, the open will be above the high of the previous day. But then, in order to drop during the day, a lowered new closing price is essential when compared to the low price of the previous day. When closing price reduces below the opening price of the previous day, it means bearish engulfing will continue in a reversal from uptrend which was in the previous.
The Dark Cloud Cover
Piercing pattern’s inverse is the Dark Cloud Cover. This happens when a bullish candlestick of the previous day is closed below the middle point by the bearish candlestick. This indicates the next day of increased price, the gapped up price continues day after prior to dropping a closing beyond or in middle among the closing and opening prices of the previous day. Of course, it is not steady like a bearish signal, but this will show the time to sell before the beginning of downtrend and overpowers previous uptrend’s profits.
Conclusion
If you want to become a technical analyst, you need to learn reversal patterns because it is essential. However, you can use candlestick patterns to identify trading opportunities and reversal signals.