
Module 5 – 54 Reversal signals.
Reversal signals
If you have studied reversal patterns, it is time to learn the reversal signals. When trading, it is essential to keep an eye on reversal signal. It doesn’t matter whether you are a trend or reversal trader; what matters is reversal signals. Without considering these signals, you will not be able to do trading successfully.
The reversal traders consider these signals as the best ways to establish trade entries. When it comes to trend traders, they use these in trading to exit or refrain from trades. If you are cautious about reversal signals, you can become a better trader over time. Anyway, now let’s discuss more reversal signals.
Impacts of reversal signals
When talking about impact, you need to know that reversal signals might have different consequences. But let’s some of the essential impacts below:
- Passive retracement- This deals with price moving sideways and then adjusts the trend accord to time.
- Triangle or flag chart pattern is commonly seen.
- Shallow retracement with proper price action.
- If the time taken for the sideway move is longer, then, range (4th point) gets in.
- Active retracement- This deals with price moving in the direction of counter-trend to adjust the trend using pips.
- As per the timeframe, the depth of retracement may vary.
- The deeper retracement is seen in a higher time frame.
- This is an impulsive retracement.
- Reversal- trend direction changes from up to down OR down to up.
- Range – The range environment follows once a trend stops.
In this case, you have to be considerate of analysis of more than one-time frame because:
- When compared to lower time frames, the higher time frame gets more respect when the reversal signals occur.
- When a time frame has more than one reversal signal, it offers more confluence. Therefore, it enhances the odd signal’s effect
- When more than one-time frame has more than one reversal signal, it enhances the odds of the signal’s price effect.
It would help if you remembered that reversal chart patterns and signals don’t act immediately; therefore, it will take some time. So, try to remain patient until it plays out.
As you have learned the impacts of reversal signals, let’s move to learn the ways to handle reversal signals.
Ways to handle reversal signals
Most traders commonly use the below discusses ways, let’s get started.
Divergence-
If you are looking for the most common method, it must be divergence. Until the trend is firm, you can consider it as your friend. The trend becomes unstable when there is no sufficient momentum. If the oscillator isn’t confirming the similar higher highs of price action and if the price is reaching higher lows and higher highs, you must know that the chance of a continuation of the trend is reducing.
So, it indicates that active retracement, passive retracement, reversal, or range might occur. If you consider retracement, a continuation of the trend can be seen here. Apparently, the trend will end only when reversal or range happens.
Candlestick reversal patterns-
When you witness more chances for an odd ending, you can use candlesticks. You can identify the momentum loss of with-the-trend when you witness engulfing twins or pin bar candlesticks.
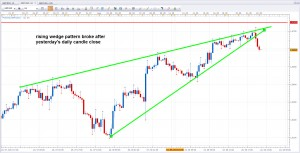
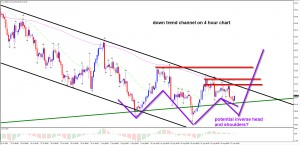
Chart patterns-
Rising wedges, head and shoulders, double top, falling wedges, inverse head and shoulders, triple top, and double bottom are some of the chart patterns that you can use in order to find the losing trend probability. Pattern completion is completed at the neckline break.
Weakness-
Only when you witness higher highs and lower lows, you can confirm a trend. If you witness that the trend is struggling to break support or resistance while forming a higher low or lower high of a price, you need to know that trend is turning against you. It is essential to be cautious about tiny hiccups if the above occurs in trend channels. Moreover, you might find higher low or high in some cases as well.
Trend channels and lines-
When a trend channel breaks, you can know it through trend ending confirmation and signal. The trend line or channel break can’t be considered an immediate reversal indication. You must be considerate that past trend has stopped, for now, so it is better to avoid trading. It would help if you waited for the evidence to continue trading.
Break of top or bottom-
This shows that you are likely to find range formation, and so reversal chances are high.
Analysis of time frames-
As for the time frame, you can decide the likelihood of the continuation of the trend. If
the time taken to develop a move is higher, then the continuation of the trend is low.
Conclusion
We have successfully discussed everything related to trading. Our course will help you understand the ways to get started and to continue your journey as a trader or investor. Make sure to read, learn, and continue learning throughout your trading journey.