
Module 2 – 14 Volume Analysis.
What is Volume Analysis about?
When it comes to trading, the volume is an important term as it represents the number of a stock’s shares that are traded on a stock exchange in a day or a period of time and it is the sole factor that confirms trend directions. It measures how much a given financial asset was traded in a particular period of time or how many times it was bought and sold. Thus, Volume analysis is simply known as the examination of the number of shares or contracts of a security that has been traded in a given specific time period.
This is usually used by technical analysts because they can get to know the liquidity level of an asset and is an important factor for their trading decisions. Traders can analyze the trends in the volume and determine changes in a security’s price. If you are a beginner, I suggest you get your grip on this metric to prepare for a trading journey with more profits and minimal risks.
Breaking it down

Volume basically refers to the number of shares transacted per day. Usually if the stock price and volume increase, there is a possibility that a fundamental or psychological factor is driving the stock price. An example would be expecting an increase which is a psychological factor that indicates a buying interest. This is a sign of a bullish trend or reversal.
When stock prices increase and volume decreases, this prevents buying any stocks as there is a possibility that the trend could change.
In another instance where stock price decreases and volume increases, there can be a factor driving the stock price. This could even be a downtrend or a selling interest in the stock. This could be a bearish trend or reversal or mostly known as a sign of a potential reversal and could be a lack of interest.
However, when both stock price and volume decrease, this shows the trader’s indecision to sell the stock as there is a possibility of a trend change. This arises because there are no factors that influence any participants. Traders usually look at the volume and pattern to identify the trend and use it as entry and exit signals.
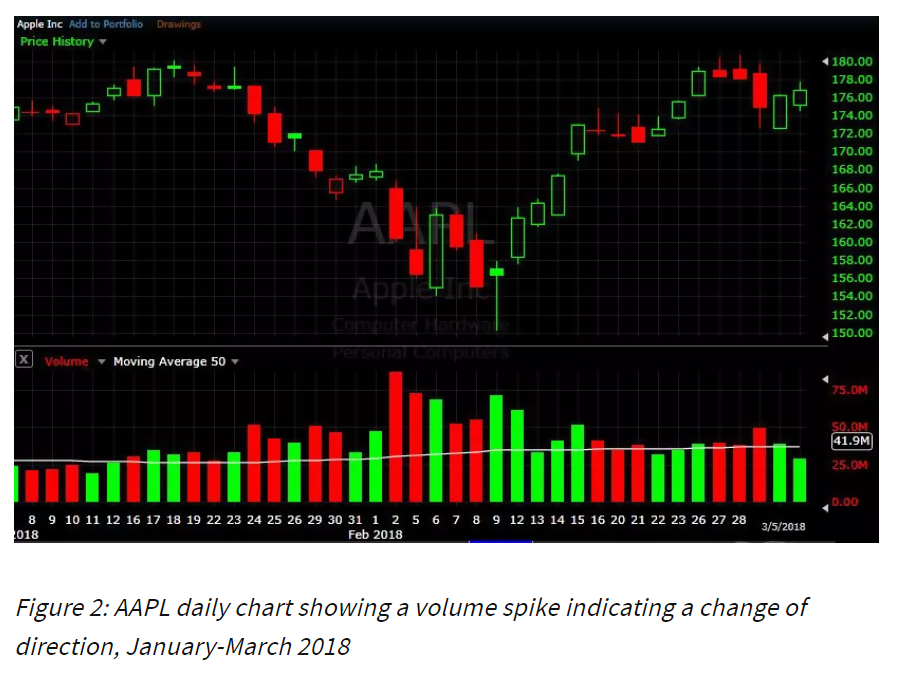
Look at this guideline below. While it might not always be this way, it generally follows a pattern as shown. This determines the weakness or strength of the move.

Usually, volume charts display these average trendlines and this is an important factor for trading decisions. You tend to have a more balanced view of the market factors so that you can make a better-informed decision. Measuring this can increase profits and minimize risks as it is a powerful aspect that is usually overlooked.
Similarly, volume history is also equally important and needs to be recent. Looking at trends that are 50 60 years old is irrelevant. The more recent it is, the more relevant it will be.
Volume indicators
These indicators use mathematical formulas that are represented in the charts. While their use is not compulsory, they certainly help in trading decisions.
On-Balance Volume
This technical trading momentum indicator uses volume flow to predict changes in the stock price. Although it uses a simple mechanism, it is quite effective. It provides a running total and also shows which stocks are accumulated. This is done by adding volume on up days and subtracting volume on down days, thus measuring the buying-selling pressure.
Chaikin Money Flow
This works in an oscillating manner to check the buying-selling pressure within a set period of time. It is a short-term indicator suitable to observe any divergences. It is calculated by looking at the period close. If the period closes in the upper half of the range, buying pressure is high and if the period closes in the lower range, selling pressure is high.
Klinger Oscillator
This is known as a trend reversal indicator and relies on volume force. It compares the volume flowing through securities with the price changes and converts to an oscillator. It basically shows the difference between two moving averages. You can also add a signal line as an additional trade signal.
In technical analysis, there are two indicators known as PVI (Positive volume index) and NVI (Negative volume index). It is based on the trading volume and the market price of the security on the previous day. If it increases, the PVI is adjusted whereas if it decreases, the NVI is adjusted. A change in PVI indicates higher volumes while a change in NVI highlights that prices are fluctuating.
This the formula to calculate the PVI:

This is the formula to calculate the NVI:
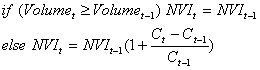
You might now understand that volume is a very significant aspect when it comes to trading and making trading decisions. Looking at trends, you can determine the changes in a security’s price. Apart from that, the indicators as well are very important to identify trends and help you make a better decision. Similarly, while volume may not be a fundamental aspect when for entry or exit, yet it can give signals. Thus, it is an important aspect that should not be overlooked by any beginner or professional trader.