
Module 2 – 15 How to trade using volume.
Now that you have an idea about what volume is and the importance of it, let’s see how we can trade using volume. If you take clear notice of volume, you will be on the safe side of the trade. You can see and identify momentum in a particular stock to confirm the trade. Let’s look into these strategies and concepts in more detail.
UNDERSTAND INVESTMENT ACTIVITY
Importance of identifying Momentum
Momentum is basically known as the rate of acceleration of a security’s price or volume and is usually used in technical analysis. Momentum is usually determined by factors such as trading volume. If trading volumes increase, prices also move in the same direction. For example, if an investor conducts a fundamental analysis of a company in which he wants to buy stocks because he can see that revenues have increased. But what is the guarantee that this will be an uptrend and won’t reverse?
In such instances, volume trading is important. If there is an increase in volume, the stock will most likely continue the uptrend which is a signal to the investors that the company is gaining momentum.
Signal of Low activity
Trading volume can also indicate an investor to sell securities due to low profits. This is because volume can give an indication of the strength of the momentum or move at a price. If there are higher volumes, it indicates that there are high activity and greater reliance. However, if there is no consistent relationship with volume and price where one increases and the other decreases, it denotes low activity and a possibility of a trend reversal. In such situations, investors sell shares as bullish uptrends may end.
STRATEGIES
On-balance Volume

This is an indicator to predict the movement of a security’s price. It keeps a running tally on volume while keeping an eye on the direction of the security. When the price increases, volume adds and when the price decreases, volume is subtracted. This is how the running total is made up of.
The use of this indicator is that price follows volume which is what many technical analysts believe in. For example, when a market is heading downtrend, institutional traders buy when the volume is low or in a declining market. When this happens, volume eventually builds up and so does the price. Now, this becomes a good investment for retail traders since it depicts a new uptrend. Institutional traders, thus begin selling to gain profits.
Basically, traders who follow trends or look into momentum/price reversals often use this indicator.
Volume by price
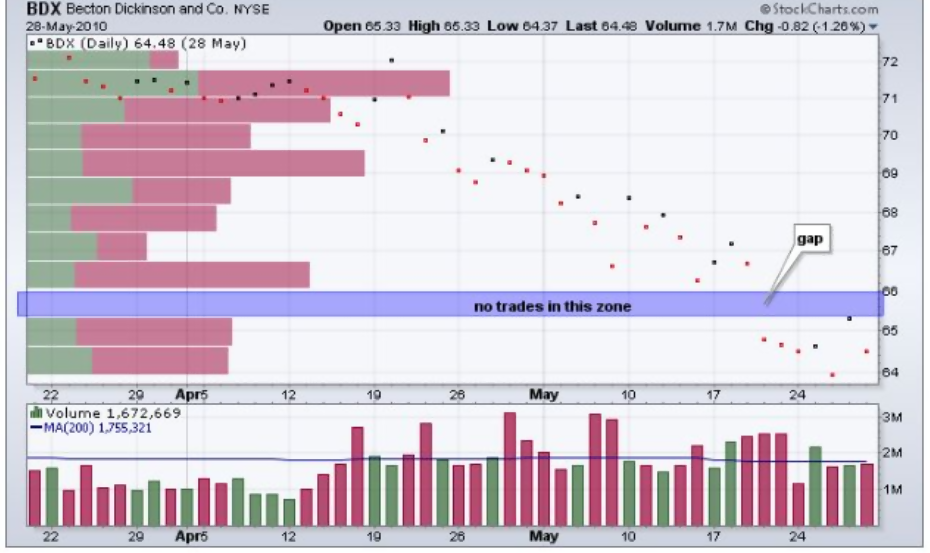
This is another indicator to show the volume for a particular price range as the name suggests. It shows you what shares were traded at a specific price level. It is a horizontal histogram where the volume of shares is shown and is plotted on the y-axis. The volume by price indicators coincides with the changes in the price. These come in a single or double color to show if the volume is up or down.
Basically, the volume shows the strength or weakness of the trend. An increase in volume shows an increase in interest whereas a decrease in volume shows a decline in interest. Also, if there are extreme volumes, you can identify reversals as well.
Thus, trading using volume is an important strategy and is used by active traders to get a steady money flow. Apart from fundamental analysis, looking into technical analysis to identify trends is equally important. Trading using volume is a key factor to consider if you, as traders want to increase profits and minimize risks.