
Module 2 – 16 Constructing bar charts.
Constructing Bar Charts
Even though we are discussing constructing bar charts, it is important to understand what it is! You might have to spend some time to understand the chart better as it is complex. Constructing a bar chart is also complicated unless you spend some time to understand it.
How to construct bar charts
A bar chart is one of the important charts used in technical analysis. This is a commonly used chart among technical traders. This is more like a stock chart that helps to display the price. The chart has a horizontal line at the bottom, and it indicates the time. And the time could be minutes, months, or even years. Let’s dive deeper into this concept.
These price bar charts usually have four components abbreviated as OHLC bars.
- Open price: the price at which the stock opens (left tic)
- High price: the highest price of the day
- Low price: lowest price of the day
- Close price: the price at which the stock closed for the day (right tic)
Two important points- Volume and open interest
Two other important information that a bar chart shows is the volume and open interest. These two metrics are vital to understanding the direction of the price. While volume is the total number of contracts that have been traded in a market, a higher volume portrays a strong bull market or an uptrend. Volume is plotted by a vertical bar that extends from the bottom of the chart.
Open interest is also equally important, which shows the total number of open and not yet closed positions, which can be long or short. It counts contracts that have open market risk. If there is a decreasing open interest, this highlights that it is a less active trading period. Therefore, participants do not take any new positions and might also close any existing ones. Open interest is plotted on a solid line above the volume bar on the chart. It also shows a vertical scale with the total number of outstanding contracts. Thus, using both these metrics will help trading better.

Different bar charts type
The usual and most common bar chart is the OHLC, as described above. You don’t really look into individual bars like in a candlestick chart. Instead, you are lured to look into the trend.
However, the other type of chart is HLC, which ignores the open and only focuses on the high, low, and close price. Yet, many traders rely on OHLC as the opening price as well as this information is also important.
Daily bar chart
This is used for short term decisions such as day traders and focuses mainly on entry and exit points. If you want to profit within the day, this is a chart you should focus on. It focuses the price security for a day and the price movements for a given time frame. It is usually shown through a bar, candlestick, or a line. See the image below.

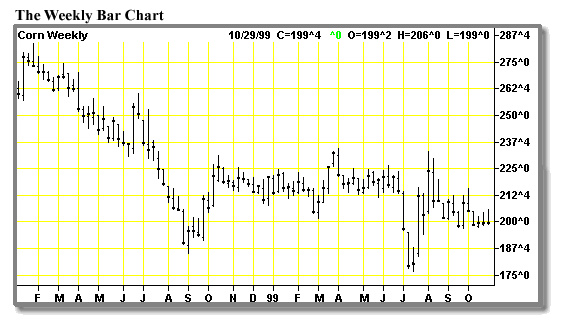
Weekly bar charts
Unlike a day bar chart, the weekly chart shows the prices though a candle, bar, or line for a single week. This is somewhat a long-term trend that is used by technical analysts for a particular asset. It summarizes the points of data for the seven days of the week. Unlike day charts, these weekly charts give a broader perspective and identify whether there are bullish or bearish trends.
Monthly bar charts
This is a long- term chart to see the movement of a price by long-term investors. While many traders don’t use these charts, but it used to analyze trends of periods over four years. The chart gives a clue as to whether it is a secular bull market or bear market of stock. Also, look at the direction of the market. You can determine entry and exit points by analyzing these monthly charts. These charts help you see the major trends in different markets. See a sample of a monthly chart below.

Why construct bar charts
If traders who use technical analysis want to trade the market successfully, they need to use the bar charts. Bar charts are complicated, but once you understand how it works, you will not have a hard time constructing it. Besides, it is pretty easy to construct the charts.
Trading online Forex means you can’t do it without using the bar chart patterns, which is why you need to learn the ways to construct bar charts. These charts help to identify investment opportunities.
Daily bar charts are specifically advantageous for short term decisions in marketing. With the use of bar charts, you can analyze the market movements.
Weekly bar charts can be used to understand the long term decisions in marketing. Also, you can make a marketing plan using the weekly chart plans.
Hence, bar chart construction is one of the important concepts in Forex trading.