
Module 2 – 18 Analysing candlestick charts.
Analyzing candlestick charts
Homma, a Japanese invented candlestick charts. He discovered that the emotions of traders influence the market significantly. However, candlestick charts were presented a hundred years before.
Different colors are used to indicate the price moves that are in different sizes to show the emotions of traders in visual form. The regular patterns are taken into consideration to explore the price’s short-directions. So, candlesticks are used by traders to make trade decisions. Below are some of the features that you can see in candlesticks:
- Based on past patterns, the price movement can be determined by the traders. So for that, candlestick charts are utilized.
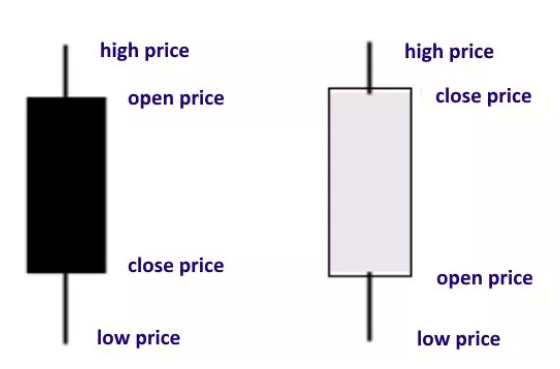
- Traders benefit from candlesticks because they indicate open, close, high, and low price points. These points help the traders as per the time they specify.
- A lot of algorithms are calculated by considering price details in the candlestick charts.
- Emotions influence trading. Therefore, you can read them with the help of candlestick charts.
Components of candlestick
The components of candlesticks are similar to the components of a bar chart. They are such as open, high, low, and then, the close price that is analyzed per day. However, as for candlestick, there is something named “real body.”
The real body in candlesticks indicates the price difference of open and close of day’s trading. The way how it works is:
- If the real body is black or filled in, then you should know that close was lower than open.
- If the real body wasn’t filled and rather empty, it means close was higher than open.
Traders have the liberty to change the colors in their platform. For instance, you might see up candles in green, not in white, whereas down candles might be in red but not black.
Hence, that’s pretty much about the candlestick components, now let’s move to the candlestick patterns.
Patterns of candlestick
The up and down movements of the prices are used when creating candlesticks. There are times when the price movements mean nothing, but there are also situations regarding trading purposes an analysis. This means the form of patterns made by the price movements become useful at times. There is a myriad of candlestick patterns.
There are two patterns, such as bearish and bullish. The bullish patterns show the chances of an increase in price. The bearish patterns show the possibilities for a decrease in price. But then again, you can’t look for a 100% perfect pattern because there isn’t any. The candlestick patterns show the price movement tendencies. Therefore, you can’t ask for guarantees.
Below are some of the candlestick patterns:
Bearish Engulfing Pattern
This happens when the sellers overpower buyers by creating uptrend. This is shown by the real body, which is in long red while it consumes small green. This pattern indicates that sellers have gotten back to control mode. Thus prices will keep declining.

Bullish Engulfing Pattern
This is the right opposite of the previous pattern, and this means buyers overpower sellers. This is shown in the chart by real bodies of long green consuming small red. When bulls are in control, the price will go higher.
Bearish Evening Star
In other words, this is a topping pattern. When the last candle opening happens below the small real body of the previous day, it turns out as bearish evening start. You can see a green or red small real body. Before two days, the last candle will encompass the candle’s real body. The pattern shows sellers’ control and buyers stalling, therefore, chances for selling.
Bearish Harami
This is a small real body in red, which is inside the earlier day’s real body. Traders don’t act on this pattern, but they watch this pattern to make decisions. This pattern shows the hesitancy of the buyers. If the price moves towards higher forward, the uptrend might become a beneficial thing for traders. The down candle that follows this pattern indicates slides.
Bullish Harami
This is the opposite of the previous pattern. This deals with the downtrend. The small real body in green will happen inside the last day’s large real body in red. This indicates that the trend is in the paused situation. If this continues the next day, there could be ongoing upsides.
Bearish Harami Cross
This happens in an uptrend. The Doji follows an up candle in this scenario. This is the instance where candlestick has open and close at an equal level. The Doji will be in the prior session’s real body. Hence, implications are similar to bearish harami.
Bullish Harami Cross
This happens in a downtrend. The Doji follows a down candle in this scenario. The Doji will be in the prior session’s real body. Hence, implications are similar to bullish harami.

Black and white patterns in candlestick charts
Bullish Rising Three
Long white day is the way how this pattern starts. As the trading sessions as second, third, and so on, the small real bodies will move the price lower. However, they will stay as per the price range of the long white day. Another long white day could be the last and the fifth day of the pattern.
The pattern indicates a falling price for three consecutive days, yet the new low is not being sighted. However, the bull traders will get ready for the next move up.
Bearish Falling Three
This pattern begins with a strong down day. The upward progress follows three small real bodies, yet remains within the first big down day’s range. The pattern will be complete when the significant downward move happens on the fifth day. This indicates the seller’s control, and so the price will head lower.
Wrapping up
The emotions that revolve around the assets have a more significant impact on the movements of the assets. Therefore, with the help of candlesticks, the traders will be able to handle their emotions related to trade decisions.